Why Distributors Should Stop Comparing Chargers by kW Alone
Home / Blog / Guidelines / Why Distributors Should Stop Comparing Chargers by kW Alone
22 Sep, 2026
DC fast charger comparison
EV charger buying guide for distributors
EV charger efficiency curve
EV charger specifications
kW rating tells you the ceiling, not the reality — two 120kW chargers can differ by 15% in actual energy delivered over a year because of efficiency curves, thermal derating, and duty cycle mismatches. Distributors who source on kW alone are essentially buying a spec sheet number, not a performance guarantee. The smarter approach is comparing chargers across efficiency at partial load, cooling architecture, module design, and total cost of ownership — because that’s where the real differentiation (and the real margin) lives.
The kW Number Is a Ceiling, Not a Promise
Here’s a mistake almost every new distributor makes: they see ‘rated at 180kW’ and assume that’s what the customer gets, all day, every day. It isn’t. A charger’s nameplate kW is measured under ideal lab conditions — full sun-shaded ambient, fresh unit, optimal grid voltage. Real deployments rarely look like that.
The number that actually matters is how much power the unit delivers at 60% ambient humidity, after two hours of continuous operation, on a summer afternoon in Phoenix or Dubai. That’s where thermal derating quietly eats into your rated capacity — sometimes by 20-30% on poorly designed units.
A Quick Gut Check
Ask any supplier for their derating curve, not just their spec sheet. If they can’t produce one, that’s your answer.
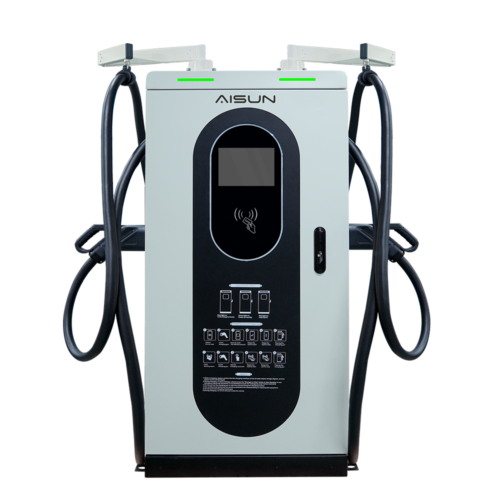
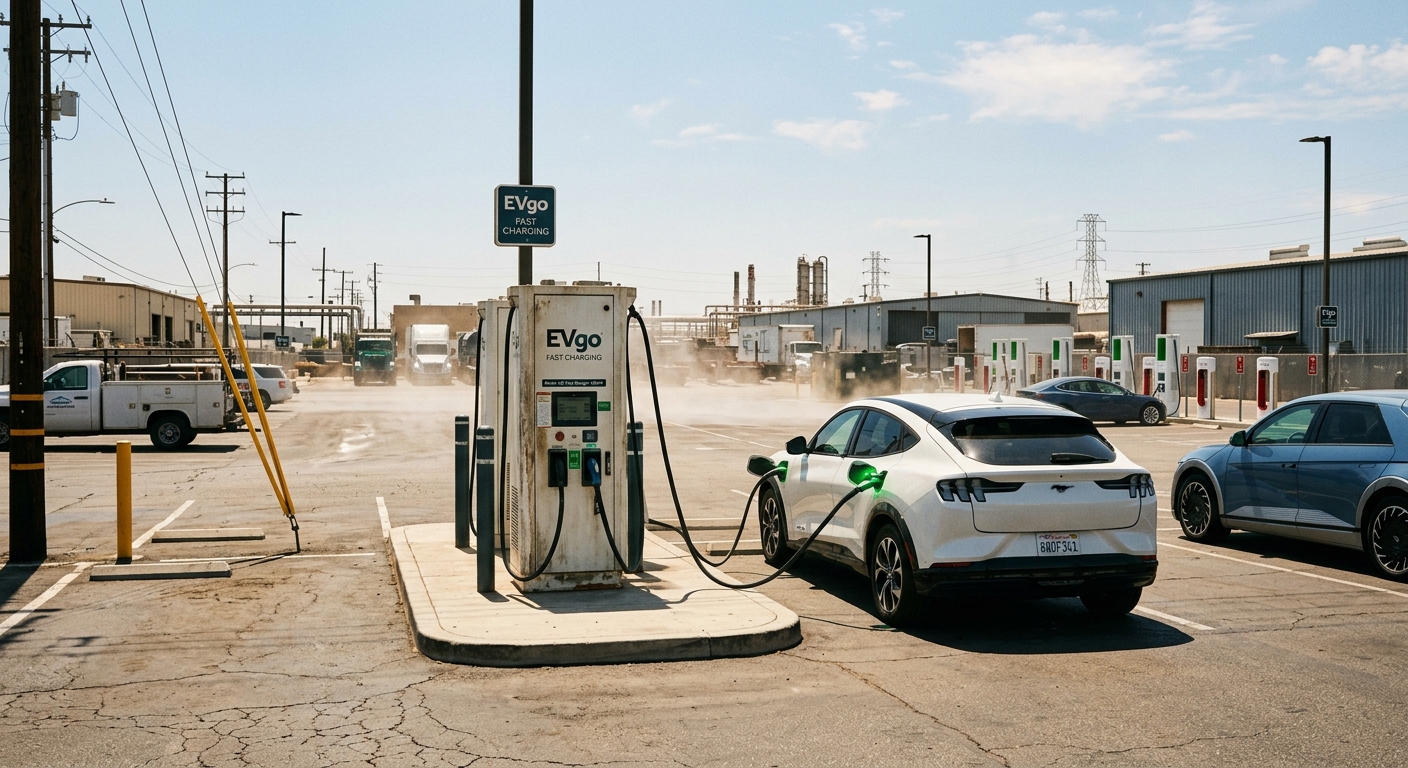
Outdoor DC fast charger operating under hot summer sunlight showing thermal stress conditions
Efficiency Curves Matter More Than Peak Output
Most DC chargers spend the majority of their operating hours below 50% load — not at peak. A fleet depot charging overnight, a retail lot with sporadic traffic, a forklift bay between shifts: none of these run chargers at 100% output continuously.
This is exactly why efficiency at partial load matters more than efficiency at rated capacity. A charger that’s 96% efficient at full load but only 88% efficient at 30% load will waste significantly more energy over its lifetime than one with a flatter curve — even if its peak kW number looks identical on paper.
For instance, a distributor supplying a retail shopping center charging hub found that two ‘identical’ 60kW units differed by 6% in monthly electricity draw for the same number of charging sessions. The cheaper unit’s efficiency dropped sharply below 40% load — which is where it operated most of the time.
Power Module Architecture Predicts Reliability
kW rating says nothing about how that power is generated internally — and that’s often the biggest predictor of failure rates. A charger built with fewer, larger power modules concentrates risk: if one module fails, you lose a large chunk of output at once. Modular designs with smaller, redundant power blocks degrade gracefully instead of failing catastrophically.
This is covered in depth in our breakdown of 360kW charger power module architecture, but the short version for distributors: ask what happens to output when one module fails. If the answer is ‘the whole unit shuts down,’ that’s a liability you’re passing on to your customer.
Modular vs. Monolithic — Which Wins on TCO?
We’ve also compared modular versus monolithic charger design on total cost of ownership. Spoiler: modular almost always wins for high-utilization sites, even at a higher upfront price.
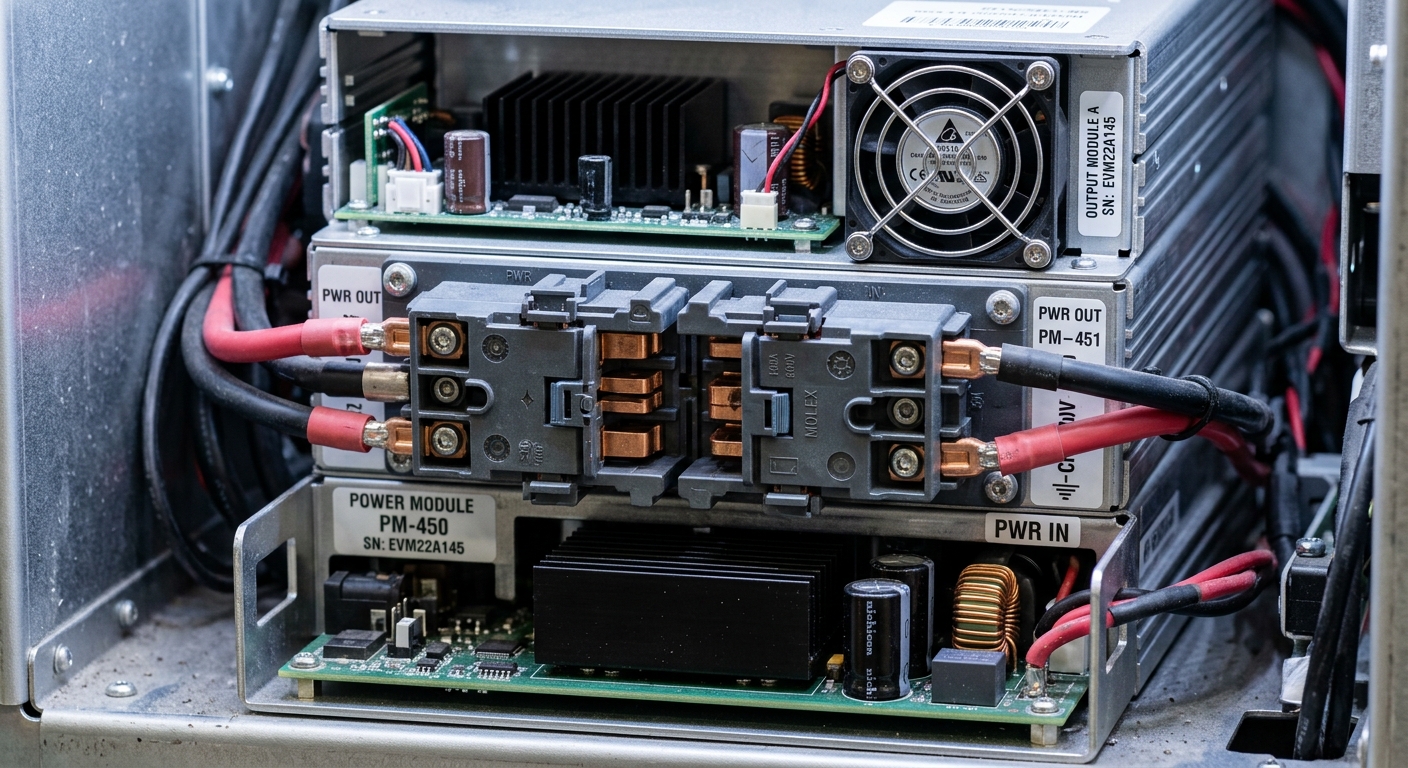
Modular power electronics blocks inside an EV charger cabinet illustrating redundant design
Cooling Method Changes the Real-World Duty Cycle
Two chargers rated at the same kW can have completely different sustainable duty cycles depending on whether they use liquid or air cooling. Air-cooled units are cheaper and simpler, but they throttle faster under sustained high-load use — exactly the scenario you’ll see in heavy-duty truck charging or busy fleet depots.
This extends to the cables themselves. Our guide on liquid-cooled vs. air-cooled charging cables shows that cable design can bottleneck a charger’s real output even when the internal electronics could handle more — another factor kW ratings never disclose.
Site Infrastructure Costs Hide Behind the kW Label
A higher kW charger isn’t automatically the better deal once you factor in what it demands from the site. Bigger chargers need bigger transformers, heavier cabling, and sometimes utility upgrades that can cost more than the charger itself.
This is why load balancing and dynamic power sharing often make more sense than oversizing a single unit’s kW rating. A site with four 60kW chargers sharing power dynamically can outperform two 120kW units on both cost and practical throughput, especially for fleet charging applications where vehicles don’t all arrive needing max power simultaneously.
Some operators are even avoiding grid upgrades entirely with buffered storage — a strategy worth understanding if you’re quoting large sites. See battery-buffered DC fast chargers versus grid upgrades for the cost comparison.
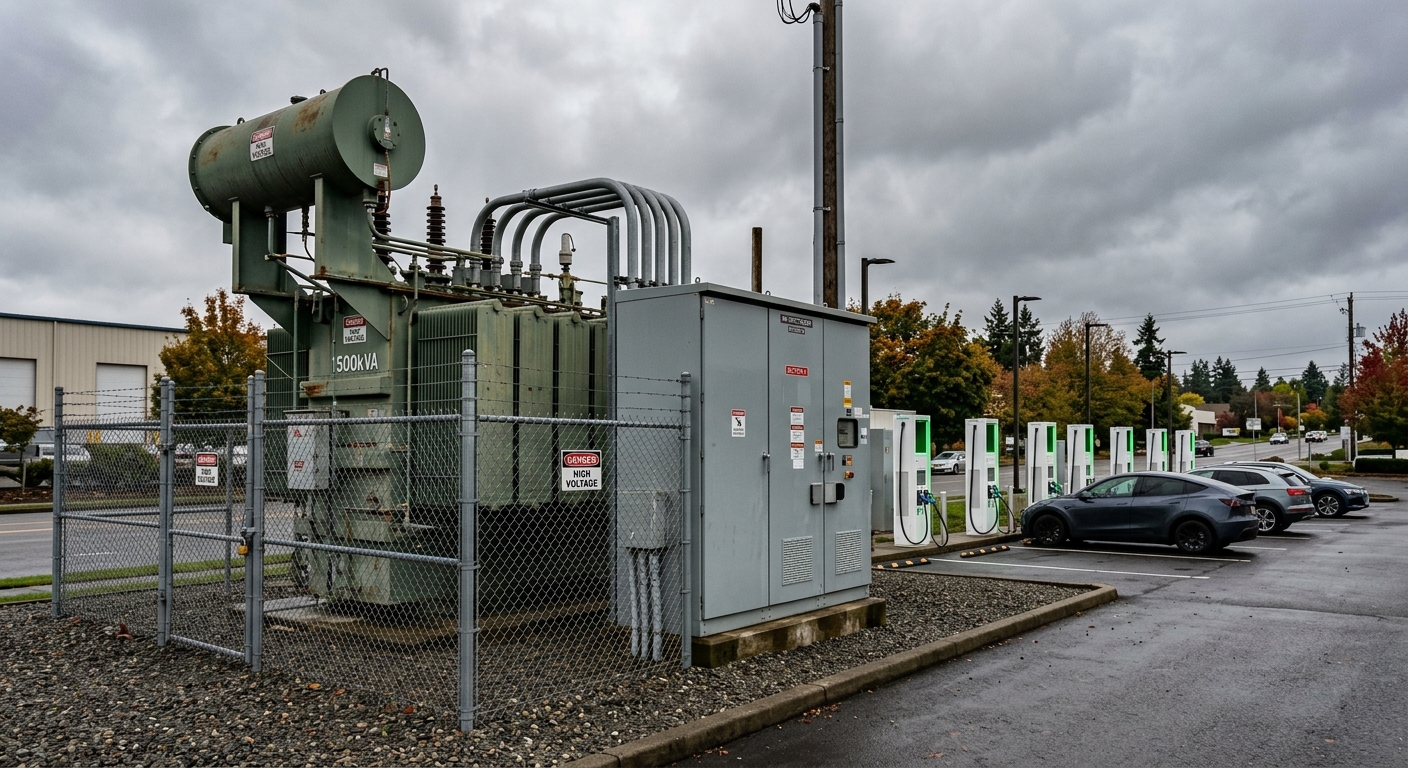
Electrical transformer and switchgear infrastructure supporting an EV charging site
AC vs. DC: kW Comparisons Break Down Completely Here
Comparing a 22kW AC charger to a 60kW DC charger by kW number alone is almost meaningless — they solve different problems entirely. AC units are for dwell-time charging where vehicles sit for hours; DC units are for turnaround speed. Stocking the wrong one because the kW number looked competitive is a common and costly distributor mistake.
For a foundational refresher, understanding AC chargers is a good starting point for newer sales teams.
The Warranty Claim You Don’t See Coming
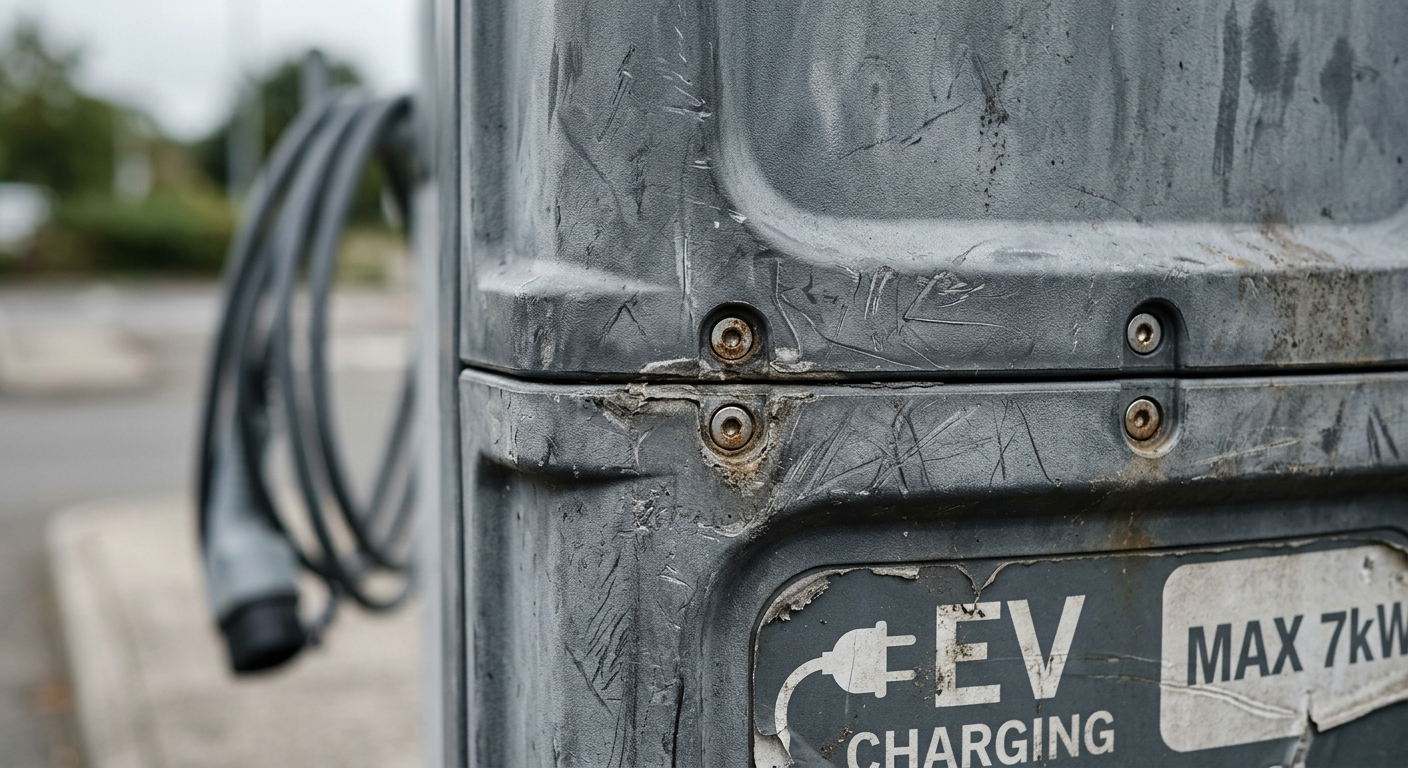
Here’s the pattern we hear from distributors again and again: they win a deal on a slightly cheaper, higher-kW-sounding charger, and eighteen months later they’re fielding warranty claims that erase the margin they thought they’d banked. kW comparisons never reveal component sourcing quality, IP rating durability, or enclosure material choices — all of which determine whether a unit survives five years outdoors or fails at year two.
Weathered outdoor EV charger enclosure showing signs of long-term wear and material fatigue
What to Actually Ask Suppliers Instead
Skip the kW-first question. Start with these instead:
What’s the efficiency curve at 25%, 50%, and 100% load?
What’s the derating behavior above 35°C ambient, sustained for 3+ hours?
Is the power module design modular or monolithic, and what happens on partial failure?
What’s the real-world duty cycle rating, not just the peak spec?
What does the enclosure and cooling architecture cost in maintenance over 5 years?
These questions separate a supplier who understands engineering from one who’s just repeating a spec sheet. If you’re formalizing this into a sourcing process, our RFP procurement checklist gives you a structured framework to apply exactly this thinking at scale. And for a broader foundational view, our ultimate guide to choosing an EV charger is worth revisiting before your next order.
Subscribe the newsletter to get updated to news and promotions
Cookies give you a personalized experience,Сookie files help us to enhance your experience using our website, simplify navigation, keep our website safe and assist in our marketing efforts. By clicking "Accept", you agree to the storing of cookies on your device for these purposes. Click "Adjust" to adjust your cookie preferences.For more information, review our Cookie Policy