Workplace EV Charging: Sizing Employee Ports for Real Commute Dwell Times
Home / Blog / Guidelines / Workplace EV Charging: Sizing Employee Ports for Real Commute Dwell Times
29 Oct, 2026
commercial EV charger load calculation
employee EV charging port count
how many EV chargers for an office
workplace charging dwell time
Size workplace charging from energy, not from headcount or stall count: take the kWh your commuting EVs must recover each working day, divide by the hours a car is genuinely plugged in, and you get the port power and port count the site needs. For most offices that lands on 7 to 11 kW AC ports, and the ratio of ports to EV-driving employees is almost always lower than the parking lot suggests once dwell time and load management are accounted for. What follows is the arithmetic, run end to end on a hypothetical campus and finished with a specification you can forward to a contractor.
Key takeaways
Port count comes from daily commute energy divided by the energy one port can deliver in the effective plug-in window, not from the parking count.
Effective plug-in hours are shorter than the working day, and they multiply with port kW, so the power tier cannot be chosen before the dwell assumption is fixed.
Connected load is ports times nameplate kW; diversified peak is that figure times a coincidence factor, and the difference is often what decides whether a transformer is needed.
Doubling the EV adoption assumption roughly doubles the port count but not the service: port hardware scales cheaply, feeder capacity does not.
A pricing and turnover policy can roughly double port throughput without adding a single kW of service capacity.
How Many Workplace Chargers Does an Office Actually Need? The Four-Input Formula
Anyone can count parking stalls. The count tells you almost nothing about how much electrical capacity to buy, which is why workplace projects so often reach a budget holder as either a four-port pilot with no load study behind it or a forty-port wish list with no feeder to supply it.
Four inputs decide the answer, and every one of them has to be written down before the first product discussion:
Daily kWh each EV commuter must recover. A commute figure, not a battery capacity.
Effective dwell hours. The hours a car is actually connected, which is shorter than the working day.
Port power in kW. What the port can deliver, and separately what the car can accept.
Usable fraction. The share of the plug-in window that delivers energy once late arrivals, early departures, driver error and port sharing are accounted for.
Written out, the model is:
Ports needed = (EV commuters per day × kWh recovered per car) ÷ (effective dwell hours × port kW × usable fraction)
Run it with your own assumptions and then invert it. If the port count is fixed by budget or by a landlord’s cap, you are solving for range instead:
kWh per car per day = (ports × effective dwell hours × port kW × usable fraction) ÷ EV commuters per day
Divide that by the vehicle’s consumption per kilometre and you have the daily range the site can guarantee. That number is what you publish to employees, and it is honest because it comes from the same arithmetic as the hardware.
The kWh term deserves care. Round-trip distance multiplied by vehicle consumption, minus whatever home charging already covers, averaged across the fleet. Get the second part from two survey questions: what is your one-way commute distance band, and can you charge at home? Assuming every driver arrives empty overstates demand by a wide margin.
A short pass with round numbers shows the shape of it. Take 100 EV commuters averaging 8 kWh to recover, so 800 kWh per day. An 11 kW port working 6 effective hours at a usable fraction of 0.75 delivers about 49.5 kWh per day. That is 17 ports for 100 drivers. Two outputs come out of this section and both feed everything downstream: a port count and a kW per port. Revising one without the other is how a design drifts.
Calculations and a parking layout sketch used to size a workplace EV charging installation
Commute Dwell Time Sets the Charger Count, Not the Parking Count
Dwell time is not the length of the working day. Arrive at 08:30, leave at 17:30 and the nominal window is nine hours. Subtract the walk from the car, the first meeting, the move at lunch, the second meeting, and the drivers who unplug a car that should have stayed connected. What is left is the effective plug-in window. Take six hours as a working assumption for an office site, then replace it with your own arrival, departure and unplug data before you fix a port count, because the gap between nine and six is where most sizing optimism dies.
Energy per port per day is the number that matters: kW × effective hours × usable fraction. A 7 kW port that sees seven effective hours delivers more than an 11 kW port that only sees four. You cannot pick the power tier before the dwell assumption is fixed, because the two multiply.
Two populations share one site and confuse the average. Long-dwell staff need a partial top-up and will be connected for most of the day. Short-dwell visitors, mobile workers and pool cars need speed and will be connected for an hour or two. Segment them before adding power, because a site that mixes them averages two incompatible requirements.
Turnover is a lever with a better return than another feeder. Where a port can deliver a full day’s need in half a day, a two-session policy or an idle fee roughly doubles throughput with no additional kW of service capacity. Charge scheduling and access rules belong in the sizing spreadsheet, not in an HR document circulated three weeks before commissioning.
Then there is the stranded minority. Employees in rented flats and homes without off-street parking cannot charge anywhere but work. They need full-recovery sessions, and they are the group a partial-top-up policy fails first. Size for them explicitly rather than letting an average hide them.
7, 11 or 22 kW: Matching Port Power to the Vehicle, Not the Brochure
The onboard charger is the ceiling, and it is the number buyers forget. Many three-phase vehicles accept 11 kW. A 22 kW port makes those cars no faster and delivers no more energy across an eight-hour day, so the extra kW buys nothing except a heavier feeder. Specify 22 kW only where the vehicles on site genuinely accept it and the dwell window is short.
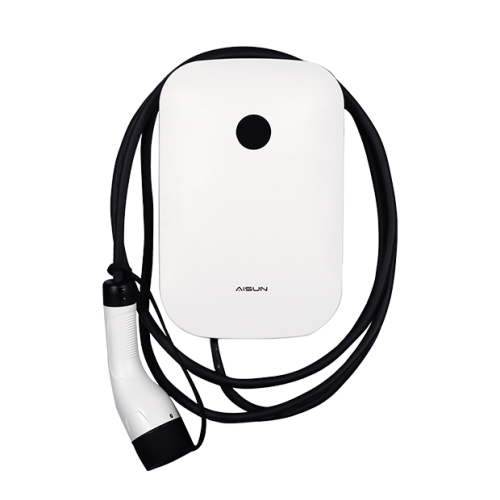
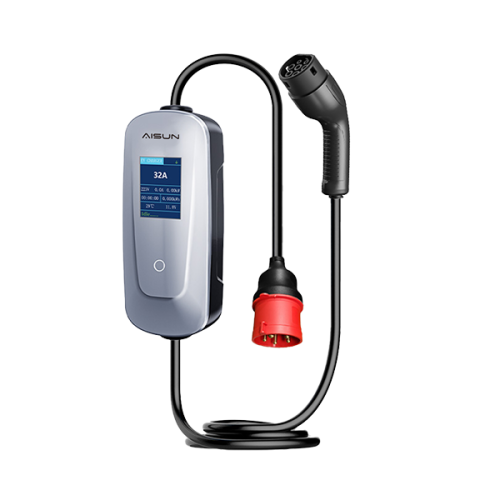
Phase supply often decides the tier before the vehicle does. AiPower’s AC EV Charger covers a 7 kW, 11 kW and 22 kW power range on 230 V single-phase or 400 V three-phase input. If the building has single-phase only, 7 kW is not a compromise, it is the available envelope, and the question becomes a service question rather than a charger question.
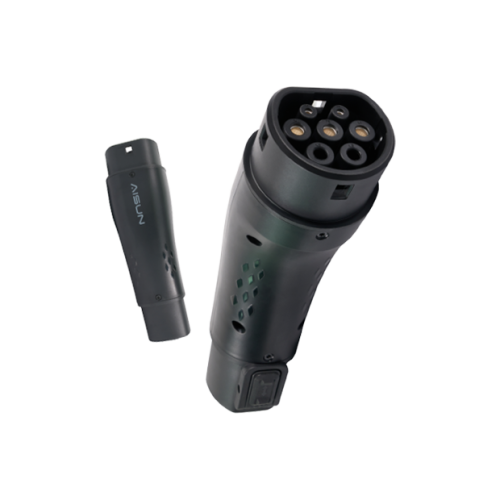
Connector choice follows the market: Type 2 for three-phase Europe, SAE J1772 for North American single-phase, and NACS on a growing share of North American vehicles. Tethered versus socketed is a maintenance decision as much as a commercial one. A socketed port pushes cable cost onto the driver, and pushes cable neglect onto your fault log.
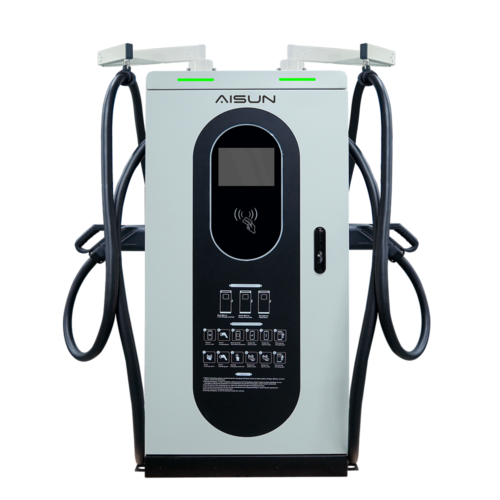
DC has an honest workplace role, and it is not the staff top-up. It belongs on a small number of bays serving visitors, pool cars and car-share vehicles with short dwell, or where the service cannot carry enough AC ports to cover demand. Keep those bays separate from employee parking or they will be occupied from 08:00 to 18:00 by the same two cars.
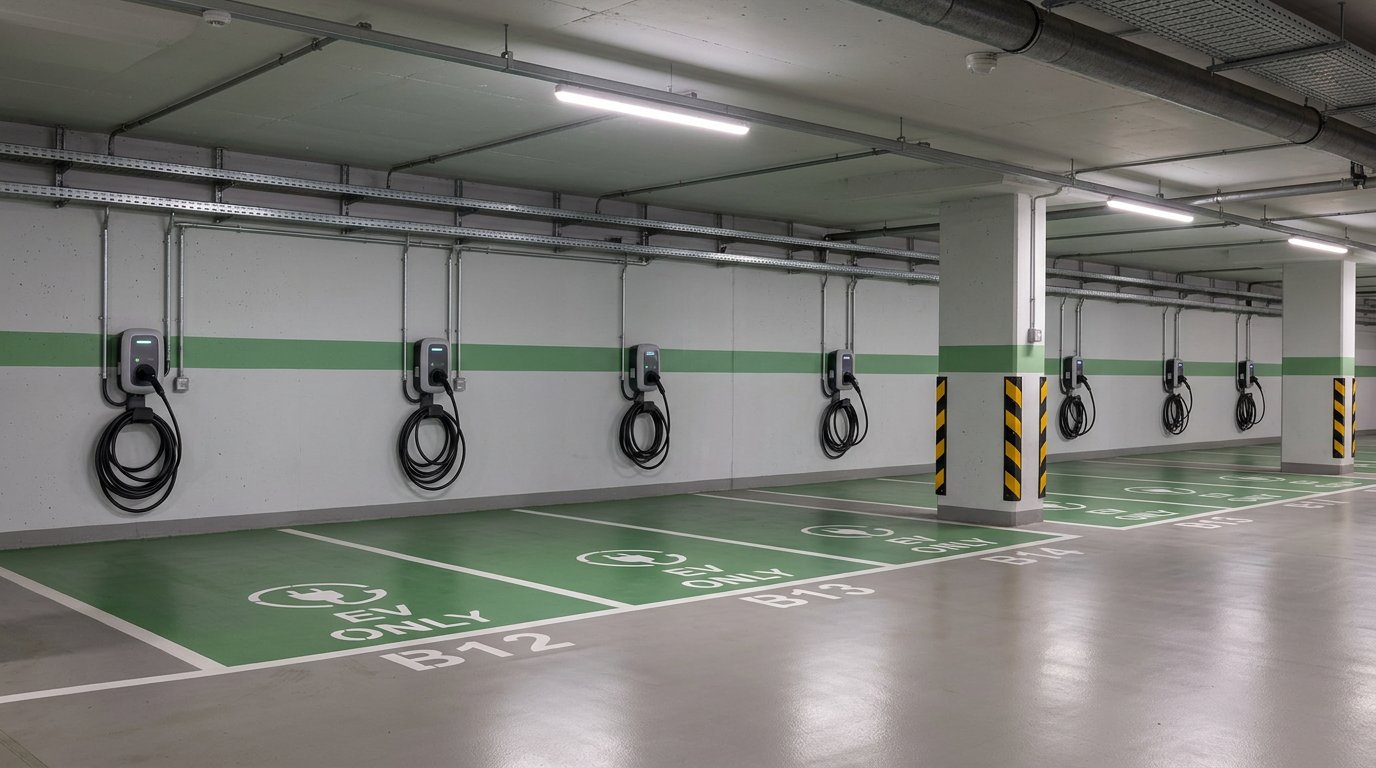
Row of AC EV charging units with coiled cables in a commercial office parking garage
The Load Calculation: Why 60 Ports Don’t Need 60 Ports’ Worth of Power
Connected load is ports multiplied by nameplate kW. Diversified peak is what actually flows when only a fraction of those ports draw at once. The gap between the two is the capacity you are really buying, and it is frequently the difference between a new transformer and no transformer at all. Quoting connected load in a utility submission asks the network to fund a worst case that a managed site will rarely approach.
Diversified demand = ports × port kW × coincidence factor.
What moves the factor: arrival clustering, session length relative to dwell, the share of vehicles that accept the full port power, and whether the site enforces turnover. A garage where everyone plugs in at 08:40 behaves differently from one where charging is scheduled across the morning.
Get the factor from evidence, not from a blog post, including this one. Published diversity figures travel badly between sites because they depend on occupancy patterns that are local by definition. Two sources work: a week of sub-metering on a comparable existing installation, or a staged rollout where phase one is metered before phase two is ordered.
Static load management caps each port and is simple, but it strands capacity on a half-empty lot. Dynamic management shifts a site total between ports and against the building’s own load, delivering more kWh from the same service. The mechanism, including how chargers negotiate a shared ceiling, is covered in smart charging technology and grid interaction.
Charging is the most controllable load in the building. HVAC, lifts, kitchen equipment and lighting are not. Put EV circuits behind a controller that yields to the rest of the site, and keep them off circuits serving life-safety equipment entirely.
Then read the tariff sheet before choosing hardware. Where the monthly bill is set by a 15-minute peak rather than total kWh, a site peak cap or a shifted charging window changes operating cost more than any equipment swap. Where the bill is energy-only, throughput and efficiency dominate instead. Knowing which structure applies is a ten-minute conversation with the utility or the landlord’s bill.
The upgrade is sometimes genuinely unavoidable: no spare capacity at the service, no three-phase supply, no physical room for a new feeder. Prove all three before anyone quotes a transformer, and get the proof in writing.
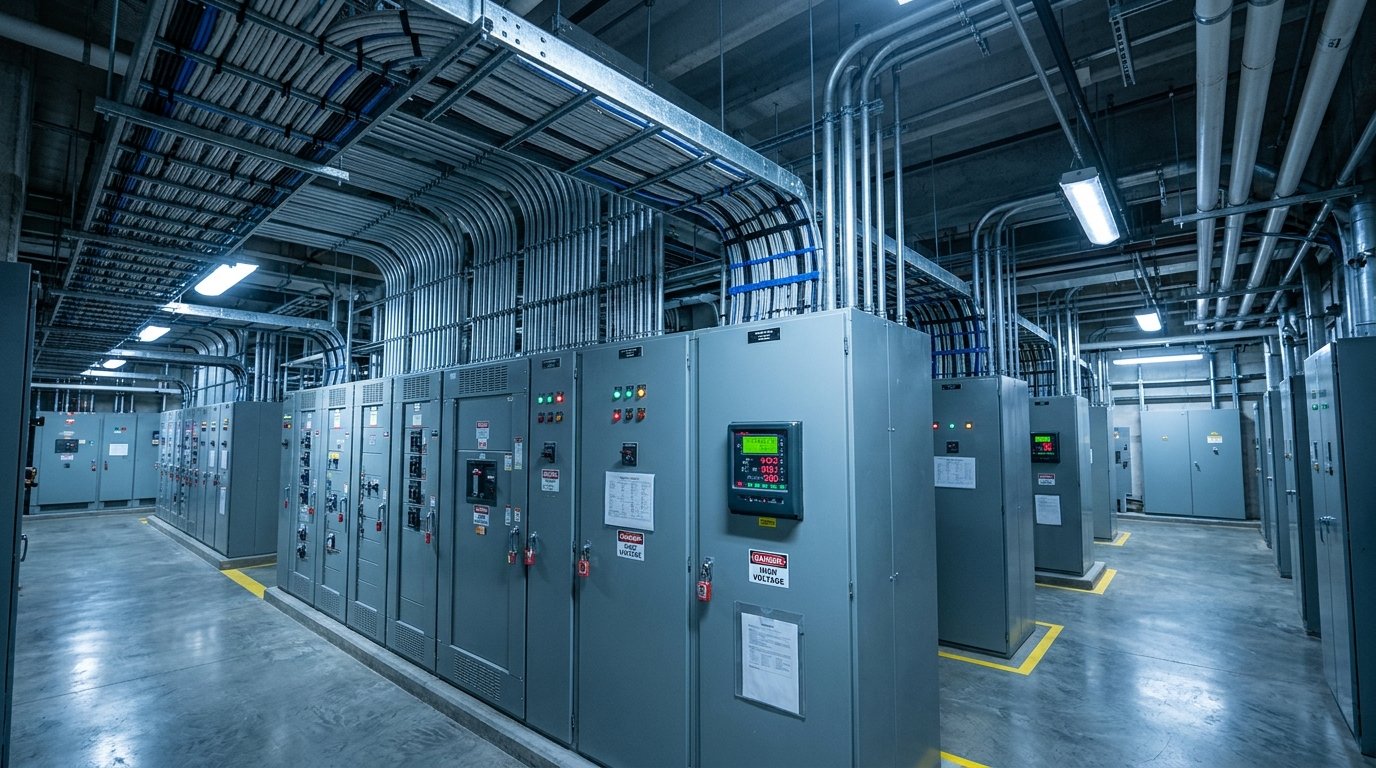
Commercial electrical distribution panels and metering equipment serving EV charging circuits
A Worked Example: A 400-Stall Campus From Parking Count to Load Schedule
The following is a hypothetical site, chosen to show the shape of the model rather than to predict any real campus. Every input is an assumption and you should substitute your own.
Assumptions: 400 stalls, 1,000 employees on site per day, an assumed 20% EV adoption, an assumed 40 km average round trip at 0.18 kWh per km, an assumed 60% of EV drivers with home charging who take a small top-up at work, an assumed 40% without home charging who recover a full commute plus errands, an effective plug-in window of 6 hours, a usable fraction of 0.75, an assumed 0.9 power factor on the service, and an assumed 0.25 coincidence on the four DC bays.
EV commuters per day. 1,000 × 0.20 = 200.
Daily energy demand. Home-charging group: 200 × 0.60 × 3 kWh = 360 kWh. No-home-charging group: 200 × 0.40 × 15 kWh = 1,200 kWh. Total 1,560 kWh per day.
Port count. Take the 49.5 kWh per port per day already derived in Section 1 and divide the daily demand by it: 1,560 ÷ 49.5 = 31.5, so 32 ports.
Power tier. 11 kW three-phase on the employee bays, with four 30 kW or larger DC units on visitor and pool-car bays.
Diversified peak, board by board. Board E1, the employee bays: connected load is 32 × 11 = 352 kW, and at an assumed coincidence factor of 0.6 the diversified peak is about 211 kW. Board E2, the four DC bays: connected load is 4 × 30 = 120 kW, and at an assumed 0.25 coincidence the diversified draw is about 30 kW. Site EV figure: 211 + 30 = 241 kW.
Does it fit? Assume the building’s existing peak is 300 kW behind a 630 kVA service. A service is rated in kVA, so convert before comparing: at an assumed 0.9 power factor, 630 × 0.9 = 567 kW of real capability. Subtract the existing 300 kW and 267 kW is available for charging. The site EV figure of 241 kW fits, with about 26 kW left over and no more.
Now double the adoption assumption to 40%. EV commuters become 400, demand becomes 3,120 kWh, ports become 63, and the employee board’s diversified peak lands near 416 kW. Add the 30 kW from the DC board and the site EV figure reaches 446 kW against the same 267 kW of available capability. No controller recovers a gap that size. The port count flexes cheaply. The service does not. That asymmetry is the entire argument for pre-building conduit and feeder capacity in year one.
Circuit
Bays served
Ports
kW per port
Connected load
Diversified peak
Headroom left
Board E1
Employee rows A to C
32
11 kW
352 kW
211 kW
56 kW before Board E2
Board E2
Visitor and pool car bays
4
30 kW or larger
120 kW minimum
30 kW at 0.25 coincidence
26 kW site-wide against 567 kW at 0.9 PF
Two review checks before anything goes to tender. First, does delivered kWh per port per day exceed what a vehicle can physically accept in that window? A single-phase car on an 11 kW port takes 7 kW, so the plan must survive that. Second, does the diversified peak leave the building’s other loads intact at the coldest afternoon of the year, not the mildest?
Build It in Phases: Conduit in Year One, Chargers in Year Three
Year one should install the ports the site can actually staff, maintain and fill. Size to measured utilisation, not to an adoption projection nobody in the meeting can defend.
Pre-build what is cheap now and brutal later. Spare conduit and pull rope to every parking row, a feeder sized for the final port count, panel space, and wall or pad space for future cabinets that will not be installed for years.
Know what a service upgrade triggers. New feeder, switchgear, utility coordination, permitting and an outage window. Doing it twice means paying mobilisation, design and downtime twice for the same outcome.
Compare retrofit pathways honestly. Core drilling through slabs, saw-cut trenching, surface trunking and routing along existing cable trays each interact differently with fire separation, drainage falls, slab reinforcement and the building’s finishes. The cheapest route on the drawing is rarely the cheapest on site.
Reserve accessible bays and their conduit in phase one even if the hardware comes later. Retrofitting an accessible bay usually means relocating the bay, not just adding a unit.
Use load management to defer the upgrade, and name the exit condition. Deferral is legitimate while metered utilisation stays below the point where drivers queue. When weekday utilisation climbs and the queue forms at the same hour every morning, the deferral has stopped being a saving and become a service problem.
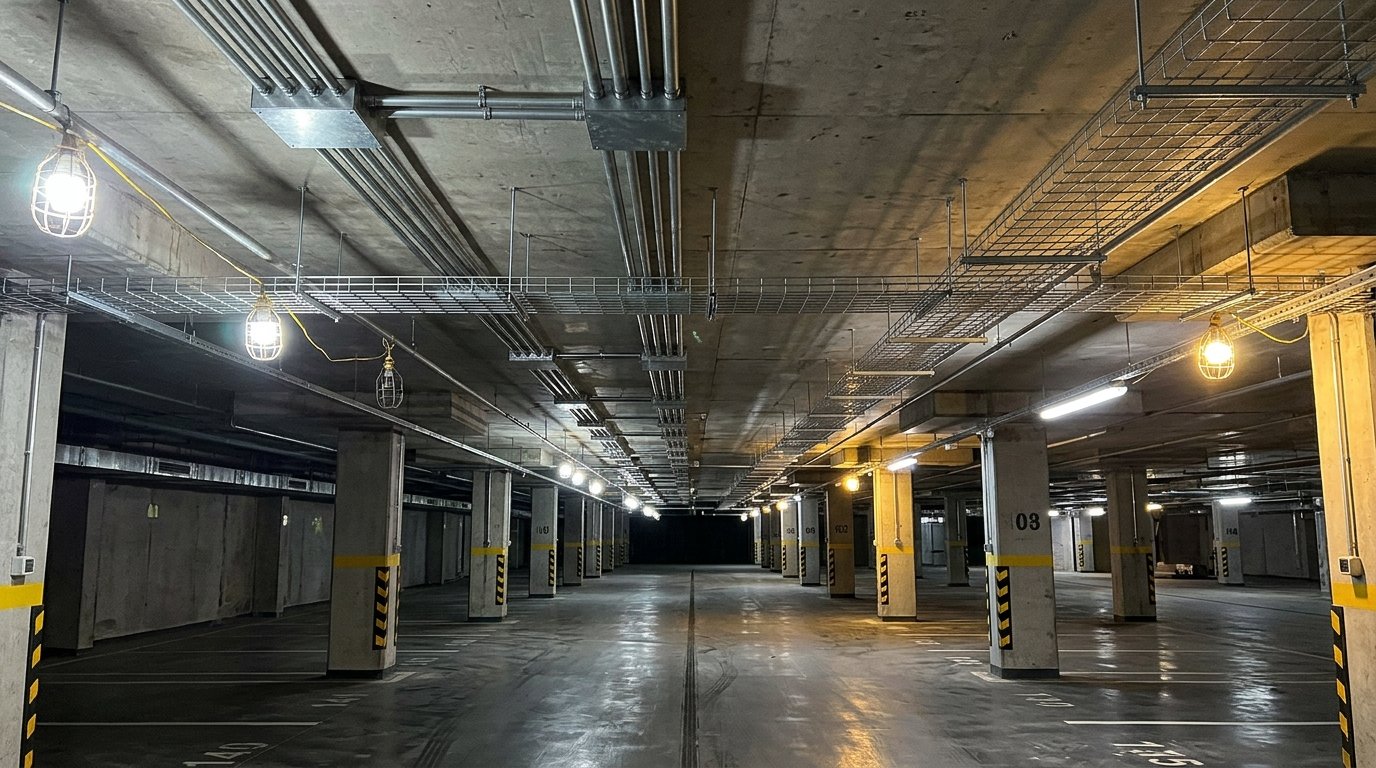
Spare conduit and cable trays installed along a parking garage ceiling ahead of future EV charger installation
Compliance and Stall Detail: What an Inspector and a Driver Both Notice
The physical layer decides whether the installation passes and whether connectors survive five winters. Treat these as design choices rather than a list of acronyms.
RCD selection. A Type A device detects residual alternating and pulsating DC current but not smooth DC leakage. A vehicle’s onboard charger can produce exactly that, which pushes the design toward Type B, or Type A paired with a 6 mA DC detection device to IEC 62955. The charging system itself sits under IEC 61851, but local code governs the final selection and your inspector’s reading of it decides the outcome.
Earthing, bonding and surge protection. Steel-framed and basement garages need equipotential bonding thought through, not assumed. Add surge protection at the feeder and at the port where the site has overhead exposure or a long cable run.
Accessible stall geometry. The connector must be reachable with the door open and a wheelchair alongside the vehicle, which constrains which side of the bay the unit sits on and how the cable routes. Check current local accessibility dimensions rather than importing figures from another jurisdiction.
Cable management above a parked car. Holster and retractor height, keeping the cable clear of paintwork, and the fact that cold-weather cable stiffness changes what actually works in February. Test the chosen holster with gloves on.
Outdoor lots. Snowplough strike zones, salt spray on connectors, and bollards placed to protect the unit without blocking a door swing or a boot lid.
Reimbursement disputes start here, and so do revenue-grade billing claims
Accuracy class quoted without certification for the destination market
Class stated, certificate named, test report attached
Market certification with test report
Determines whether the site can be inspected and energised without a workaround
A logo on a webpage
UL for North America or CE for the EU, with the specific standard cited in the report
ISO 15118 Plug and Charge readiness
Employees will expect to plug in and walk away; retrofit is rarely free
Roadmap slide with no date
Hardware and firmware path stated, with a commitment in the contract
Spares, lead time and firmware support
A failed module in year six is a commercial problem, not a technical one
Lead time quoted only at purchase
Named replacement module, stated lead time, support window after last shipment, and what happens if the vendor cloud is discontinued
Warranty terms and exclusions
Exclusions decide whether the warranty is worth anything
Duration only
Duration, labour coverage, exclusions, and the fault-triage process in writing
Ask for the answers as documents rather than assurances. A vendor that cannot produce the test report for its certification will not produce a replacement module in year six either.
What to Do Next: Size Year One, Then Let the Data Correct You
Write down three figures before any purchase order: delivered kWh per port per day, diversified site peak, and cost per kWh delivered. Every other metric in a vendor deck is a proxy for one of those three.
Month twelve review. Ports running near-continuously with queues mean add ports. Ports averaging a handful of sessions a week at high kW mean either the tier was wrong or the pricing policy is keeping drivers away. Both are correctable, and both are cheaper to correct with data than with another consultant.
Compare vendors on total cost per kWh delivered, folding in installation, network fees, energy and maintenance, not on unit price or nameplate kW.
Keep one plain question in the tender. Does the proposal state where each port’s energy comes from, in hours and kW, for the vehicles actually on site? If it cannot answer that, it is a product list.
Where the outcome is AC ports at 7, 11 or 22 kW on 230 V single-phase or 400 V three-phase, plus a small number of DC units for visitors and pool cars, evaisun builds both. The company manufactures under an OEM and ODM programme, holds UL and CE certification, and delivers to more than 30 countries, with a team that includes 60 or more engineers. The DC line runs from 30 kW to 480 kW on 380 V three-phase input, and the AC line covers the three power tiers above, so both halves of a campus plan can come from one supplier. If you want to talk through which models suit your site, get in touch with the team.
Frequently asked questions
Is 22 kW AC charging worth it for employee bays?
Rarely. Most three-phase vehicles cap their onboard charger at 11 kW, so a 22 kW port delivers nothing extra to them across an eight-hour day. The exceptions are vehicles that genuinely accept 22 kW and bays serving pool cars, car-share vehicles or visitors whose dwell window is two or three hours.
Will workplace charging require a transformer upgrade?
Not always. Connected load and diversified peak are different numbers, and a metered coincidence factor plus a load controller often fits EV demand inside existing spare capacity. An upgrade becomes unavoidable when there is no spare capacity, no three-phase supply, or no physical route for a new feeder.
Subscribe the newsletter to get updated to news and promotions
Cookies give you a personalized experience,Сookie files help us to enhance your experience using our website, simplify navigation, keep our website safe and assist in our marketing efforts. By clicking "Accept", you agree to the storing of cookies on your device for these purposes. Click "Adjust" to adjust your cookie preferences.For more information, review our Cookie Policy