The Real Reason Your DC Charger’s Efficiency Curve Matters at Partial Load
Home / Blog / Guidelines / The Real Reason Your DC Charger’s Efficiency Curve Matters at Partial Load
11 Jun, 2026
partial load efficiency
EV charger power modules
DC fast charger losses
charging station energy efficiency
Here’s the short version: your DC charger almost never runs at its rated power, so the peak efficiency number on the datasheet is mostly marketing. What actually determines your energy bill, your thermal headroom, and your module lifespan is how efficient the unit is at 20–60% load — and that’s where cheaper hardware falls off a cliff. A 360 kW charger that hits 96% peak but drops to 88% at quarter load can quietly waste tens of thousands of kWh per year compared to one that holds 94%+ across its range.
Why Peak Efficiency Is a Vanity Metric
Spec sheets love a single big number. “97% peak efficiency” looks great in a tender response. The problem is that peak efficiency typically occurs at one narrow operating point — usually somewhere between 50% and 80% of nameplate power, at a specific output voltage, at 25°C ambient.
Real EV charging sessions don’t sit there. A 200 kW session into a passenger EV holds peak power for maybe 10–15 minutes, then tapers as the battery’s BMS pulls back current above ~60% state of charge. A fleet depot? Half the bays are negotiating handshake or finishing taper at any given moment. The charger spends most of its life at partial load — and that’s exactly where many designs are weakest.
If your supplier won’t share a full efficiency curve (efficiency vs. output power, at multiple output voltages), assume the partial-load numbers are unflattering. Vendors who engineer for it tend to publish it.
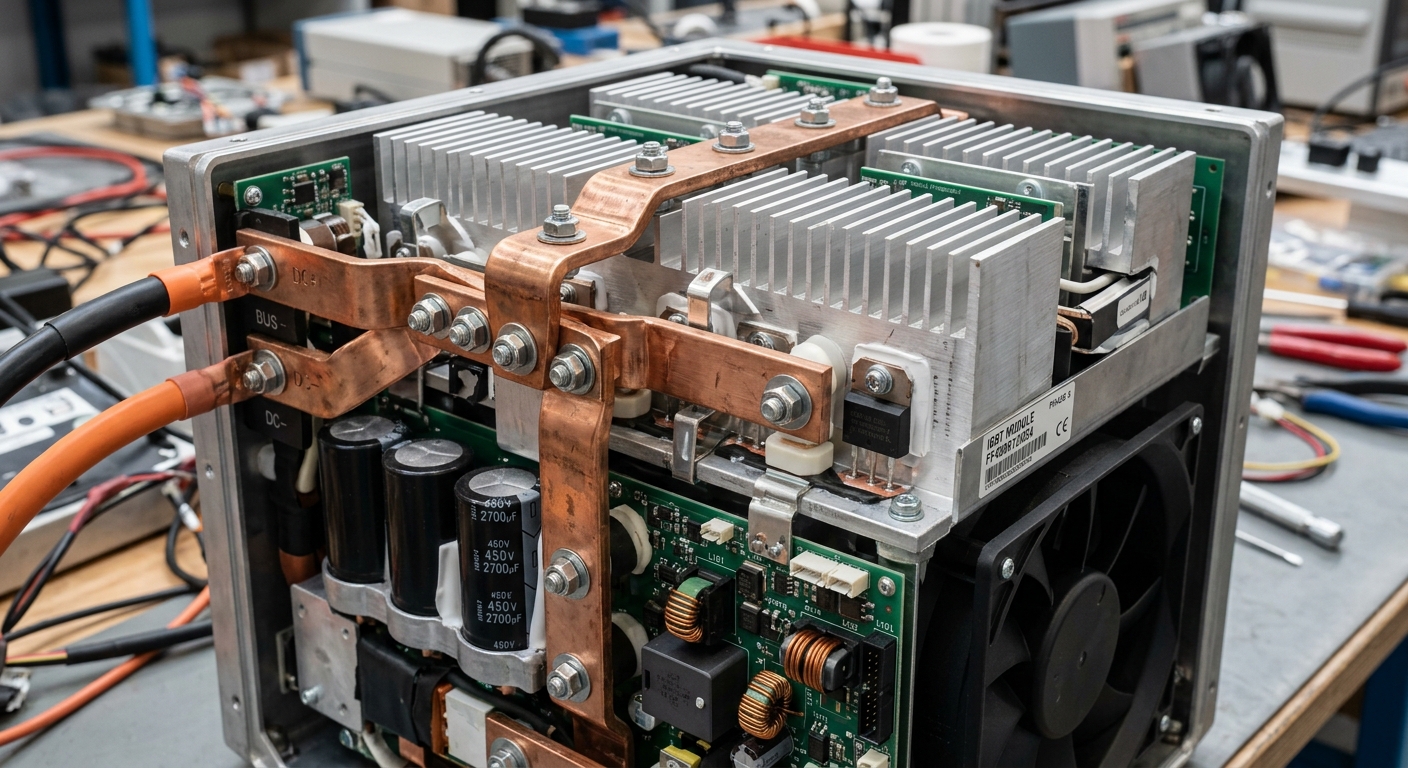
Close-up of DC charger power module internals showing semiconductors and busbars
What the Efficiency Curve Actually Looks Like
Plot efficiency on the Y-axis and output power on the X-axis, and a well-designed DC charger module looks like a flat-topped hill: it climbs quickly from low load, plateaus across a wide middle band, and only sags slightly at the extremes. A poorly designed one looks like a sharp peak — high at one spot, dropping off steeply in both directions.
The shape matters because of how losses scale. There are two main categories:
Fixed losses — control electronics, cooling fans, gate drivers, standby consumption. These don’t shrink when output drops.
Variable losses — switching losses, conduction losses in semiconductors and magnetics, which scale roughly with current.
At low output, fixed losses dominate the percentage. That’s why a module pulling 60 W of overhead looks fine at 30 kW out (0.2%) but terrible at 3 kW out (2%). Multiply that across a 12-module stack and the math gets ugly fast.
SiC vs. Silicon: Where the Gap Shows Up
Silicon carbide (SiC) MOSFETs are the single biggest reason modern modules hold efficiency at partial load. Compared to legacy silicon IGBTs, SiC devices switch faster, run hotter without degrading, and have dramatically lower switching losses — which is exactly the loss mechanism that hurts most at light load.
A conventional 30 kW silicon module might deliver 95.5% at peak and 88% at 20% load. A modern 40 kW SiC module holds 97% peak and still delivers 94% at 20% load. Over a year, on a charger averaging 40% utilization, that’s the difference between roughly 7,000 kWh and 18,000 kWh of wasted energy per cabinet. At industrial rates, that’s real money — and it’s heat your HVAC system has to remove.
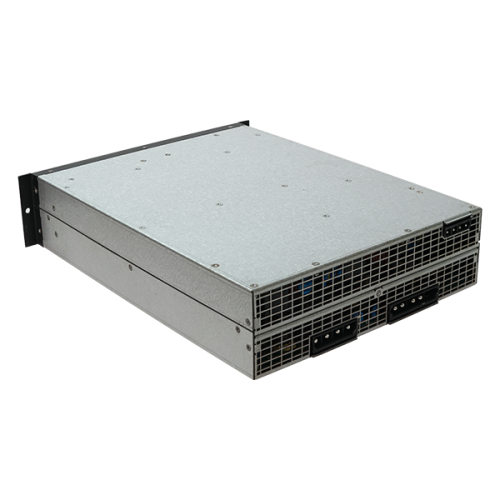
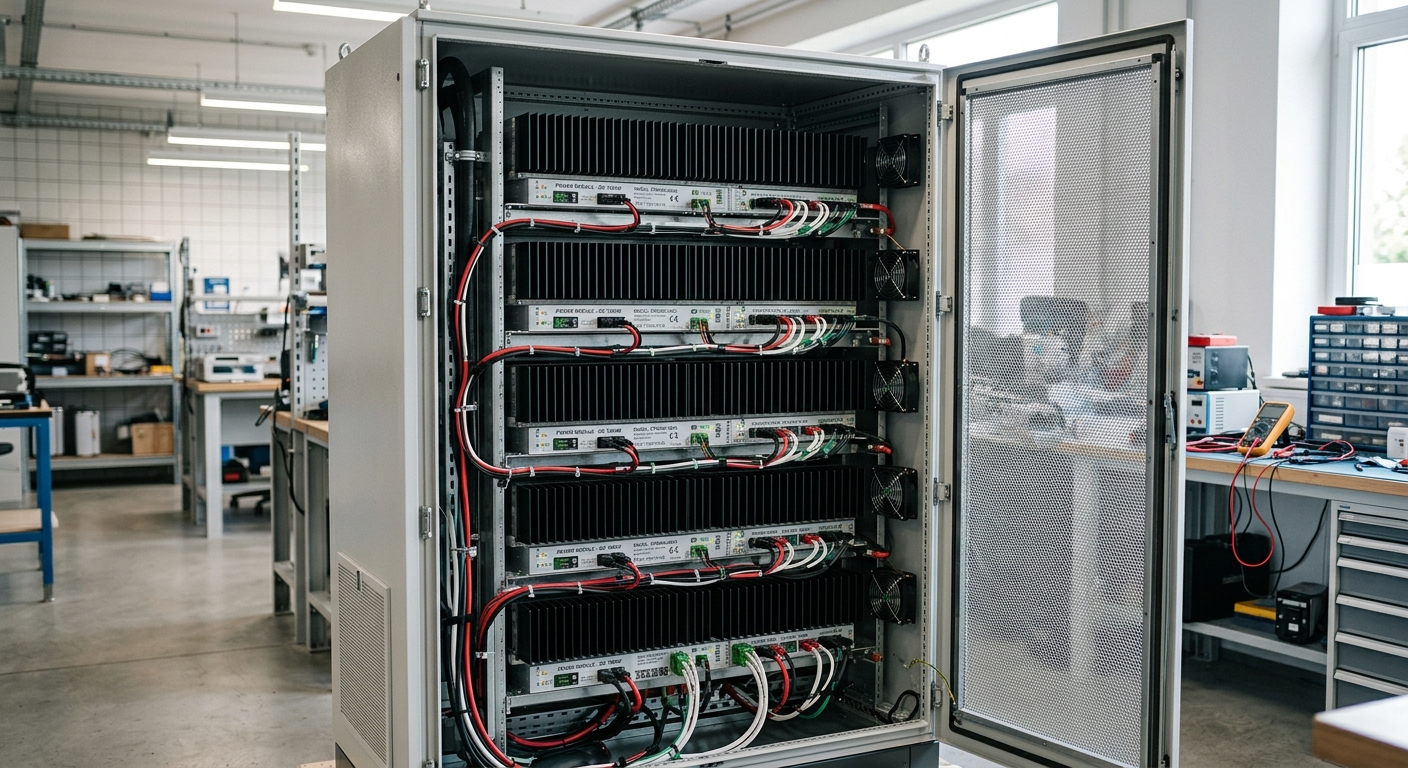
Stacked DC charger power modules inside an open service cabinet
How Power-Module Granularity Changes the Curve
This one trips up procurement teams constantly. A 360 kW cabinet built from 12 × 30 kW modules behaves very differently than the same cabinet built from 6 × 60 kW modules — even if peak ratings match.
Smarter cabinets use intelligent module sequencing: when the session only needs 80 kW, the controller activates three modules at ~90% load each and idles the rest. That keeps the active modules near their efficiency sweet spot instead of running all 12 at 22% load (where they’re inefficient and still burning fixed overhead).
For instance, a logistics operator we worked with was running a mixed fleet — light commercial vans needing 40–80 kW and heavier trucks needing 180 kW. The site originally specified large monolithic 180 kW modules. After swapping to a granular 30 kW architecture with sequencing, average cabinet efficiency at typical load profiles jumped from 89% to 95%. Same peak rating, very different electricity bill.
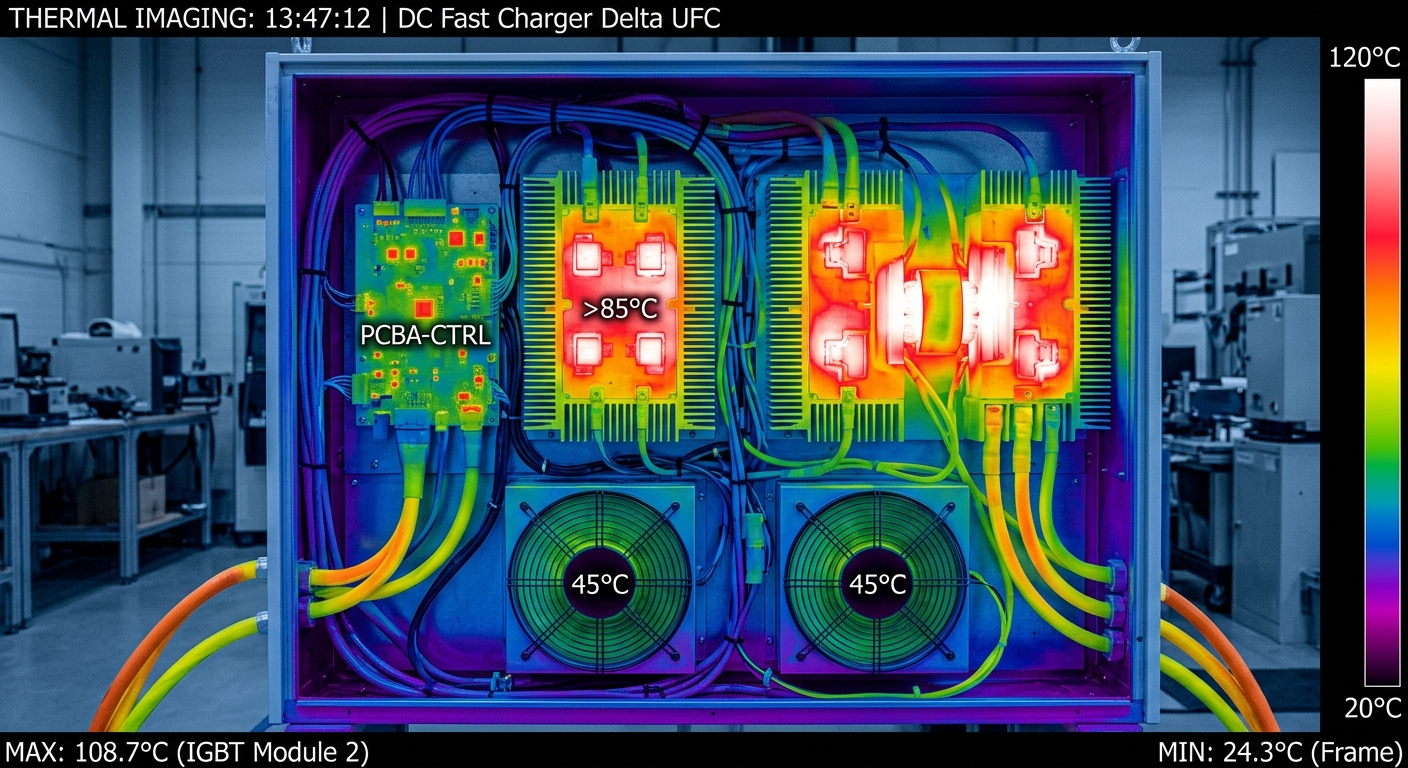
The Thermal Knock-On Effect
Lost efficiency doesn’t vanish. It becomes heat — and heat is the number one killer of capacitors, gate drivers, and connectors. A charger that wastes 11% at partial load instead of 4% has to dump that extra energy somewhere, which means harder-working fans, higher ambient inside the cabinet, and shorter component life.
This is also why partial-load efficiency interacts with summer derating. If your charger is already running thermally tight at 95% efficiency, dropping to 90% in real-world conditions can push it over the edge. We covered the mechanics in detail in why DC fast chargers derate in summer — the same physics apply, just amplified by inefficiency.
The practical takeaway: efficiency curves and thermal design are the same problem viewed from two angles. Spec one without checking the other and you’ll pay for it in service calls.
Thermal visualization of heat distribution inside a DC charger cabinet
Standby and Idle Losses: The Invisible Drain
A charger sitting idle still consumes power — for the HMI, the OCPP controller, communications, contactor coils, and module standby circuits. On older designs this can be 200–400 W per cabinet, 24/7. That’s 1,750 to 3,500 kWh per year doing nothing.
Modern designs cut idle draw to 50–100 W by aggressively gating module power and using low-quiescent-current control electronics. For a workplace charging site with 20 cabinets that mostly run during business hours, the difference between 80 W and 300 W of idle draw works out to roughly 38,000 kWh per year. That’s the kind of operational cost that doesn’t show up in the purchase quote but shows up every month on the utility bill.
If you’re sizing infrastructure for a depot or campus, factor idle consumption into your load model — it directly affects how load management strategies get tuned.
Why This Matters More for Fleets Than Highway Sites
A public highway fast-charging site sees brief, high-power sessions. Most modules run near peak for the active window. Partial-load efficiency still matters, but the impact is smaller because the duty cycle hugs the right side of the curve.
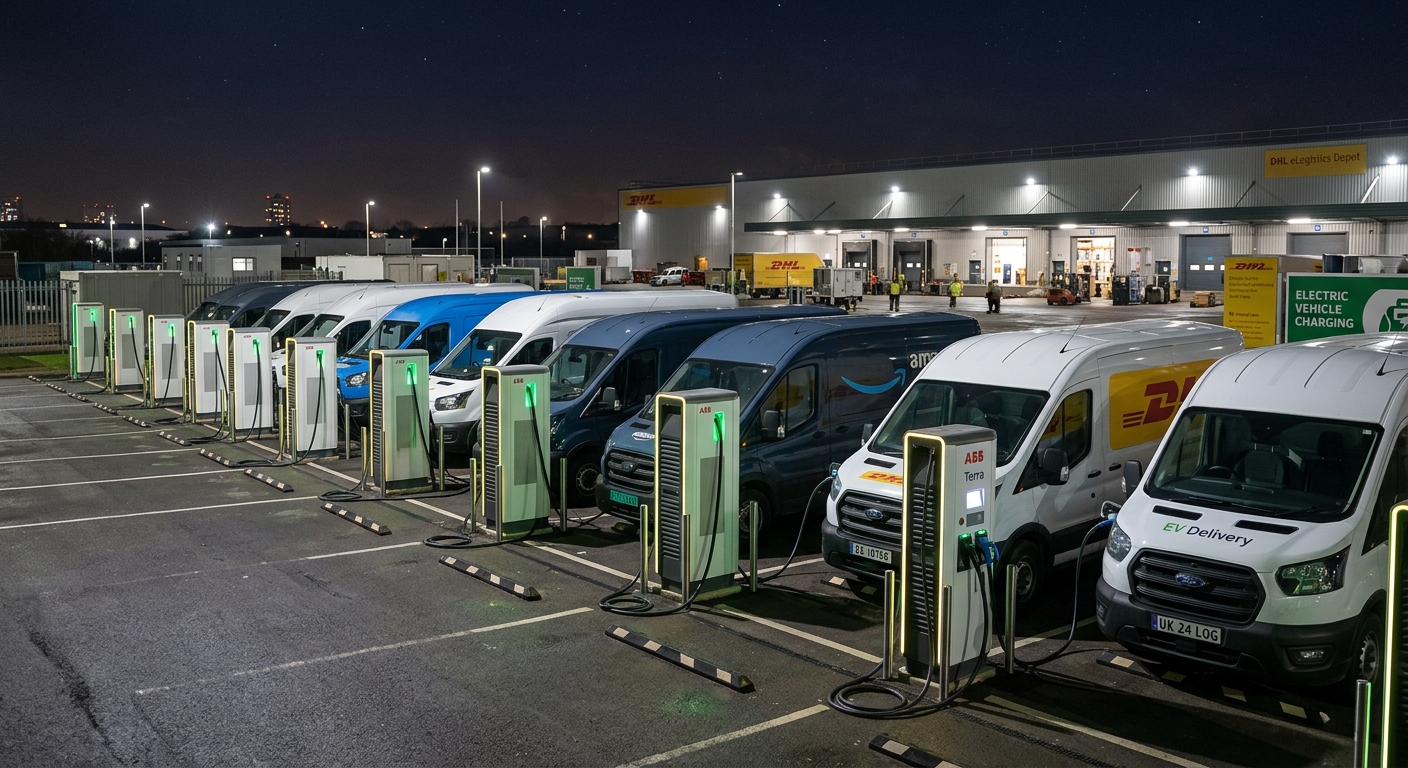
Fleet depots are the opposite. Overnight charging for a 50-vehicle van fleet means hours of low-current trickle as packs finish balancing. Forklift opportunity charging means short, low-power top-ups during shift breaks. AGV docking means very frequent, very short sessions. These applications live in the partial-load region — sometimes for 70%+ of operating hours.
Row of DC chargers serving an electric delivery van fleet at a depot at night
What to Ask Suppliers Before You Sign
If you’re specifying chargers — whether for an RFP, a distributor stocking decision, or an OEM/ODM partnership — these are the questions that separate serious vendors from the rest:
Provide the full efficiency curve from 10% to 100% rated output, at minimum three output voltages (e.g. 400 V, 600 V, 800 V).
Specify standby/idle power consumption per cabinet, measured.
State module sequencing behavior: how does the controller distribute load across modules at part-load conditions?
Provide efficiency data at elevated ambient (40°C and 45°C), not just 25°C.
Describe the semiconductor technology (SiC, GaN, Si IGBT) and topology (LLC, phase-shifted full bridge, etc.).
A supplier who hands over this data without hesitation has engineered for it. A supplier who deflects or sends back only the peak number is telling you something — listen.
Running the Numbers on Your Own Site
You don’t need a lab to estimate the cost of a bad efficiency curve. Pull the utilization data from your CMS — average power draw per session, session count per day, idle hours — and overlay it on the vendor’s efficiency curve. The integral of (1 − efficiency) × power × time across a year gives you total kWh wasted.
Plug in your electricity rate. Then compare two vendors. We’ve seen distributors who switched supplier purely on this analysis recover the price delta within 18–24 months on energy savings alone, before even counting reduced service costs from cooler-running cabinets.
The headline number on the brochure is the wrong number. The shape of the curve is the right one.
Designing for the Real Duty Cycle
The takeaway is straightforward: spec your DC chargers around how they’ll actually be used, not how the datasheet flatters them. Demand the full efficiency curve. Prioritize SiC-based modules with granular sequencing. Factor idle losses into your load model. And match module size to the typical session profile — smaller modules with intelligent sequencing almost always beat fewer, larger ones for mixed-use sites.
If you’re evaluating hardware for a fleet depot, distribution network, or commercial site and want partial-load curves backed by real test data, our engineering team is happy to share measured performance across the evaisun DC product range. Get in touch — bring your duty cycle data and we’ll model it against the curve.
Subscribe the newsletter to get updated to news and promotions
Cookies give you a personalized experience,Сookie files help us to enhance your experience using our website, simplify navigation, keep our website safe and assist in our marketing efforts. By clicking "Accept", you agree to the storing of cookies on your device for these purposes. Click "Adjust" to adjust your cookie preferences.For more information, review our Cookie Policy