Bus Depot Electrification: Pantograph vs. Plug-In Charging for Transit Fleets
Home / Blog / Guidelines / Bus Depot Electrification: Pantograph vs. Plug-In Charging for Transit Fleets
09 Jun, 2026
electric bus depot design
opportunity charging
bus depot electrification
transit fleet charging
For most bus depots, plug-in DC charging at 150–180 kW per stall is the right answer for overnight fleet replenishment, while pantograph systems make sense only when route economics demand fast opportunity charging mid-shift. The decision hinges on three things: how many hours per day your buses sit idle at the depot, whether route length exceeds usable battery range, and how much CapEx you can justify per charging point. Get those three numbers right and the technology choice becomes obvious.
The Short Answer: Match the Charger to the Duty Cycle
A 12-meter electric bus with a 350 kWh battery typically needs 4–6 hours to fully recharge on a 150 kW plug-in dispenser. If your buses return to the depot by 11 PM and pull out again at 5 AM, you have a six-hour window — perfect for plug-in. No pantograph needed.
But what if you run a high-frequency airport shuttle or BRT line with 18-hour operating days? The bus never sees a full overnight charge. That’s where pantograph opportunity charging at 450 kW pays for itself: a 6-minute top-up at the terminus adds 40 kWh, enough to complete another loop without battery downsizing.
The mistake we see most often? Transit agencies specify pantograph because it looks futuristic, then discover their actual route schedules give them eight hours of depot dwell time every night. They paid 4x the CapEx for a capability they don’t use.
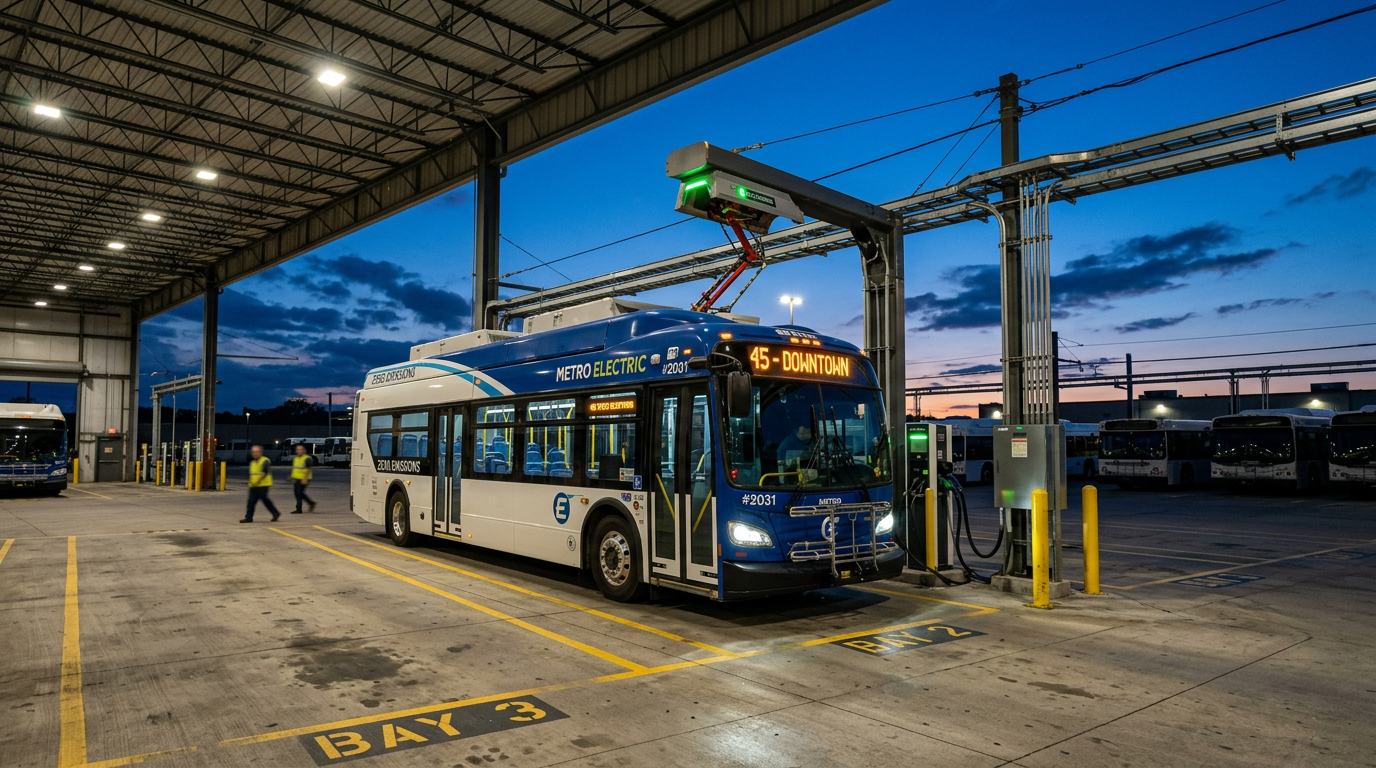
Electric transit bus parked in depot bay at dusk for overnight charging
How Pantograph Charging Actually Works
Pantograph systems come in two flavors: bus-up (the pantograph is mounted on the bus roof and rises to meet a stationary bar) and infrastructure-down (the pantograph is mounted on a gantry and descends onto contact rails on the bus roof). The OppCharge consortium and SAE J3105 standardize the infrastructure-down approach for North America and most of Europe.
Power transfer happens through four contact rails on the bus roof: DC+, DC-, ground, and a control pilot. Once the bus stops within a ±150 mm alignment tolerance, the pantograph lowers in about 6 seconds, communication handshakes complete in 10–15 seconds, and full power flows. Total dead time is typically 20–40 seconds.
Power levels range from 150 kW for small depot installations up to 600 kW for terminus opportunity chargers. The architecture relies on the same power module stacks used in high-power DC chargers — for context on how those modules behave under load, see our breakdown of 360 kW DC charger power module architecture.
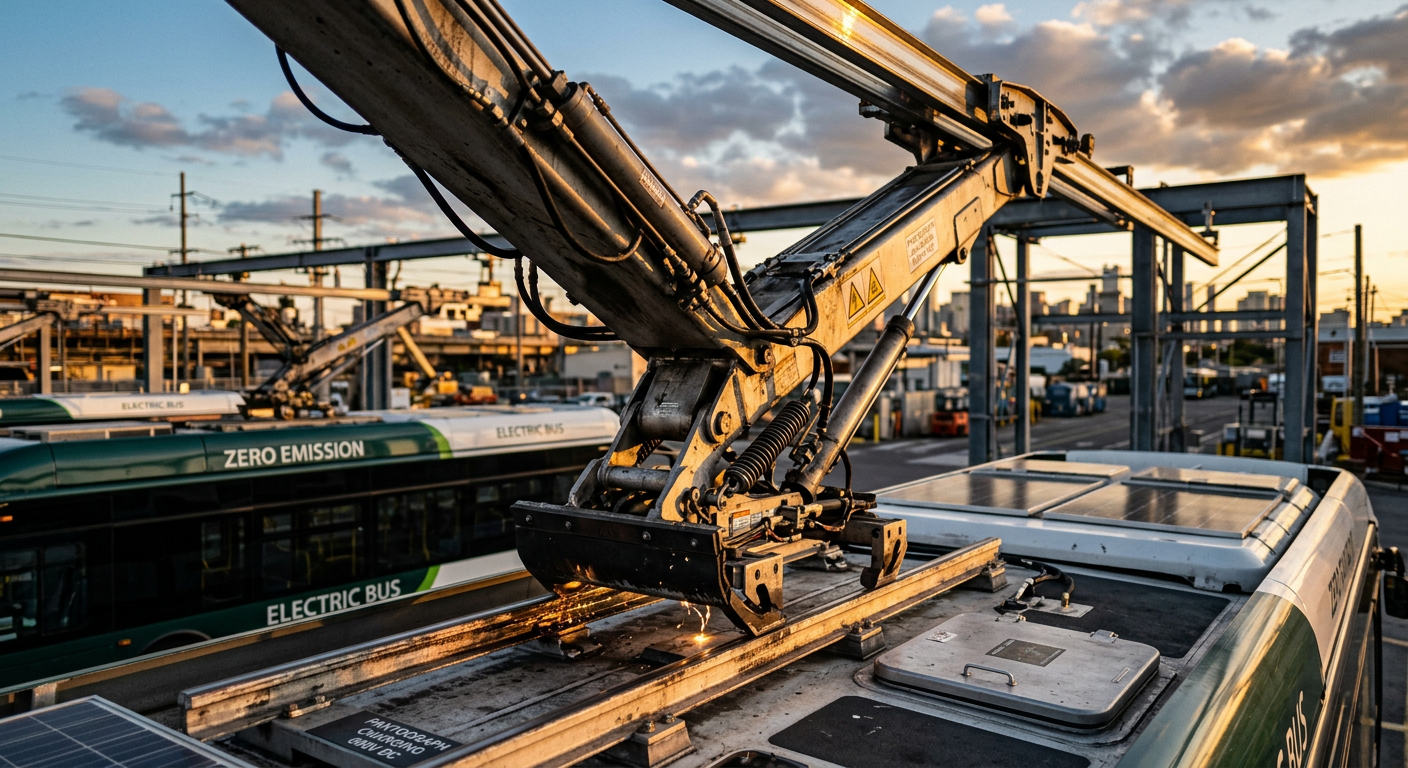
Overhead pantograph charging arm lowered onto an electric bus roof
Plug-In Depot Charging: The Quiet Workhorse
Plug-in DC charging using CCS2 (Europe, parts of Asia) or CCS1 / NACS (North America) handles 90% of transit electrification projects globally. A typical depot deployment uses 150 kW or 180 kW dispensers — sometimes paired in a 360 kW split cabinet that can dynamically allocate power between two buses.
What makes plug-in attractive isn’t peak power. It’s cost per kWh delivered. A 180 kW dispenser costs roughly $55,000–$90,000 installed, compared to $400,000+ for a comparable pantograph stall. Multiply that across a 60-bus depot and the math is brutal.
Plug-in also gives you flexibility. If you replace your bus OEM in five years, a CCS2 dispenser still works. A pantograph spec’d for OEM A may not interoperate cleanly with OEM B’s rooftop hardware. For a deeper dive on connector economics, our connector standards guide covers the cross-region picture.
Comparing the Two Side by Side
Here’s the comparison most agencies need on a single page when building a business case:
Criteria
Pantograph (Overhead)
Plug-In CCS / DC
Typical power per bus
150–600 kW
60–180 kW
Best use case
Opportunity / on-route top-up
Overnight depot charging
CapEx per dispenser
$300k–$700k installed
$45k–$120k installed
Connection time
20–40 seconds, automatic
Manual, 60–90 seconds
Civil works required
Mast, foundation, gantry
Concrete pad, cable management
Labor per shift
Minimal — hands-free
Driver or yard staff plugs in
Vehicle compatibility
OppCharge / SAE J3105 specific
Universal CCS2 / GB/T fleets
Maintenance complexity
High — moving parts, alignment
Lower — cable wear main issue
One nuance worth highlighting: pantograph CapEx hides behind utility upgrade costs. A 450 kW pantograph terminus often requires a dedicated transformer, while six 180 kW plug-in dispensers can share a single 1 MVA service through smart load management. That changes the total project cost dramatically.
A Real-World Example: Two Depots, Two Strategies
Consider two transit operators we’ve helped scope hardware for. Operator A runs 80 city buses on routes averaging 180 km per day. Buses return to depot by 10:30 PM and depart at 4:30 AM — a comfortable 6-hour window. We specified 80 plug-in dispensers at 150 kW each, with dynamic load sharing capping total site draw at 6 MW. Total installed cost: roughly $7.5M for charging equipment.
The same fleet sized with pantograph charging? Estimated $24M+ for hardware alone, plus a much heavier electrical service. The plug-in approach paid for itself by year three.
Operator B runs a 24-hour airport express line with 12 buses cycling continuously. There’s no overnight window. Here, three pantograph chargers at the airport terminus and two at the city terminus made sense — buses get 5-minute top-ups every loop and never need full charges. CapEx was higher per stall, but the alternative (doubling fleet size to allow rotation) would have cost three times more.
Lesson: route schedule dictates topology. Don’t pick a technology first and try to fit operations around it.
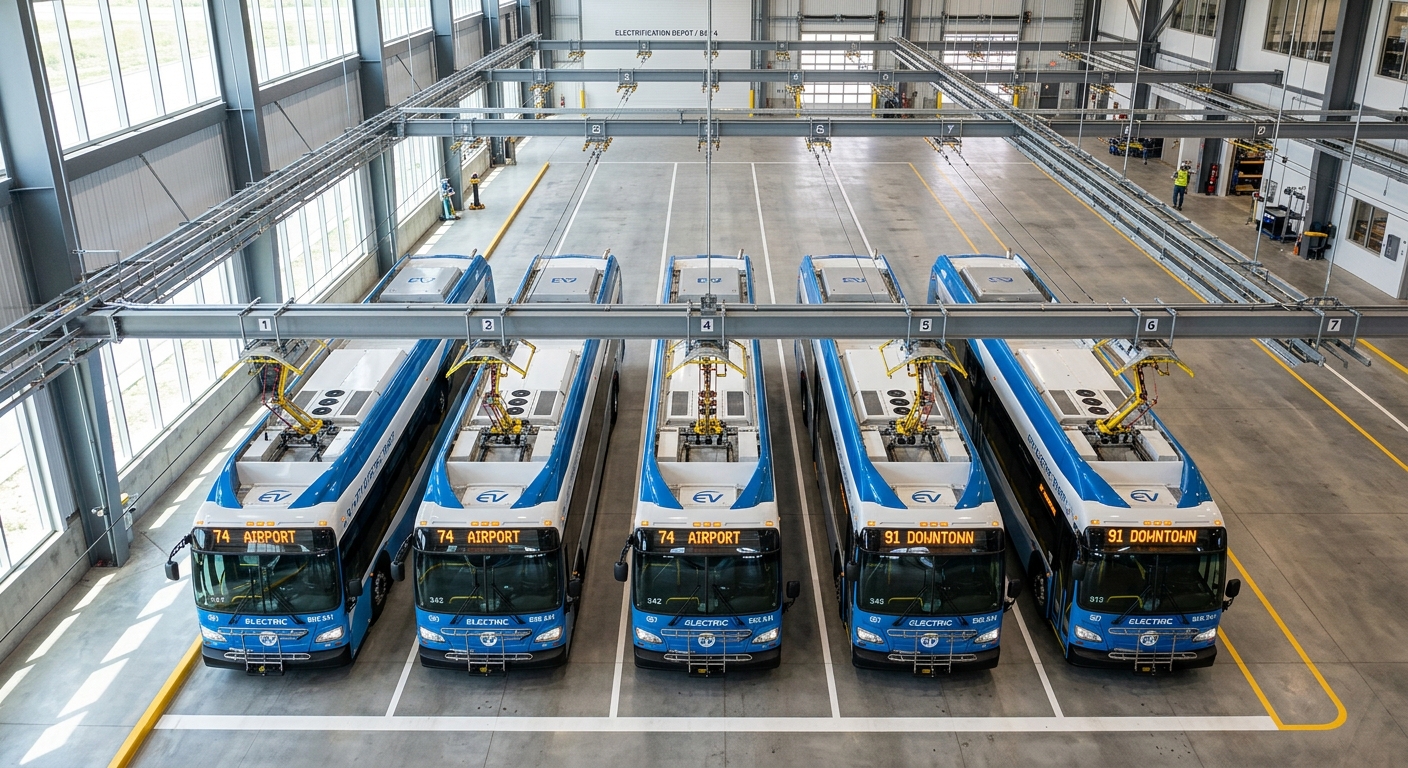
Row of electric transit buses lined up in a modern depot
Power Infrastructure: Where Most Projects Get Burned
Whatever you choose, the bottleneck is rarely the chargers — it’s the utility connection. A 60-bus depot charging simultaneously at 150 kW each would need 9 MW of service. Almost no urban depot has that headroom without a substation upgrade costing $2–8M and taking 18–36 months.
The solution is dynamic load balancing. Modern OCPP 2.0.1 systems can stagger charging across the night, peaking at 3–4 MW instead of 9 MW. Buses that need full charges get priority; topped-up buses throttle to 30 kW trickle. This single design decision usually saves more money than the choice between pantograph and plug-in.
For larger fleet rollouts, the planning mistakes we see most often are catalogued in scaling EV fleet charging infrastructure — worth reading before any RFP goes out.
Maintenance Reality Check
Pantograph systems have moving parts: linear actuators, contact bars, alignment sensors, weather seals. Expect quarterly inspections and annual contact pad replacement. Field data from European operators suggests roughly 8–15 hours of preventive maintenance per pantograph per year, plus occasional unplanned outages when alignment drifts after a freeze-thaw cycle.
Plug-in dispensers fail mostly at the cable and connector. A heavily used CCS2 cable in a transit depot lasts 3–5 years before the connector pins show enough wear to fail communication handshakes. Liquid-cooled cables last longer but cost more — our liquid-cooled vs. air-cooled cable comparison goes into the trade-offs.
In raw uptime, well-maintained plug-in chargers hover around 97–98% availability. Pantograph systems land closer to 94–96% in real-world operation. Not a dealbreaker, but it’s another reason agencies often deploy a mix: plug-in for the depot, pantograph only where route operations demand it.
Hybrid Architectures Are Becoming the Norm
The fastest-growing pattern we see in 2026 isn’t pure pantograph or pure plug-in — it’s hybrid. Depots install plug-in CCS as the baseline, with two or three pantograph stalls reserved for high-utilization buses or schedule recovery during disruptions.
This works because most modern e-buses (BYD, Yutong, New Flyer, Solaris, VDL) ship with both a CCS inlet on the side and pantograph contact rails on the roof. The same battery management system handles either input. You’re not locked in.
For agencies starting their first electrification project, we’d suggest: deploy 100% plug-in for years one and two, gather operational data on actual dwell times and SoC patterns, then add pantograph stalls in year three only if data justifies them. It’s much harder to remove a $500k pantograph that doesn’t get used than to add one later.
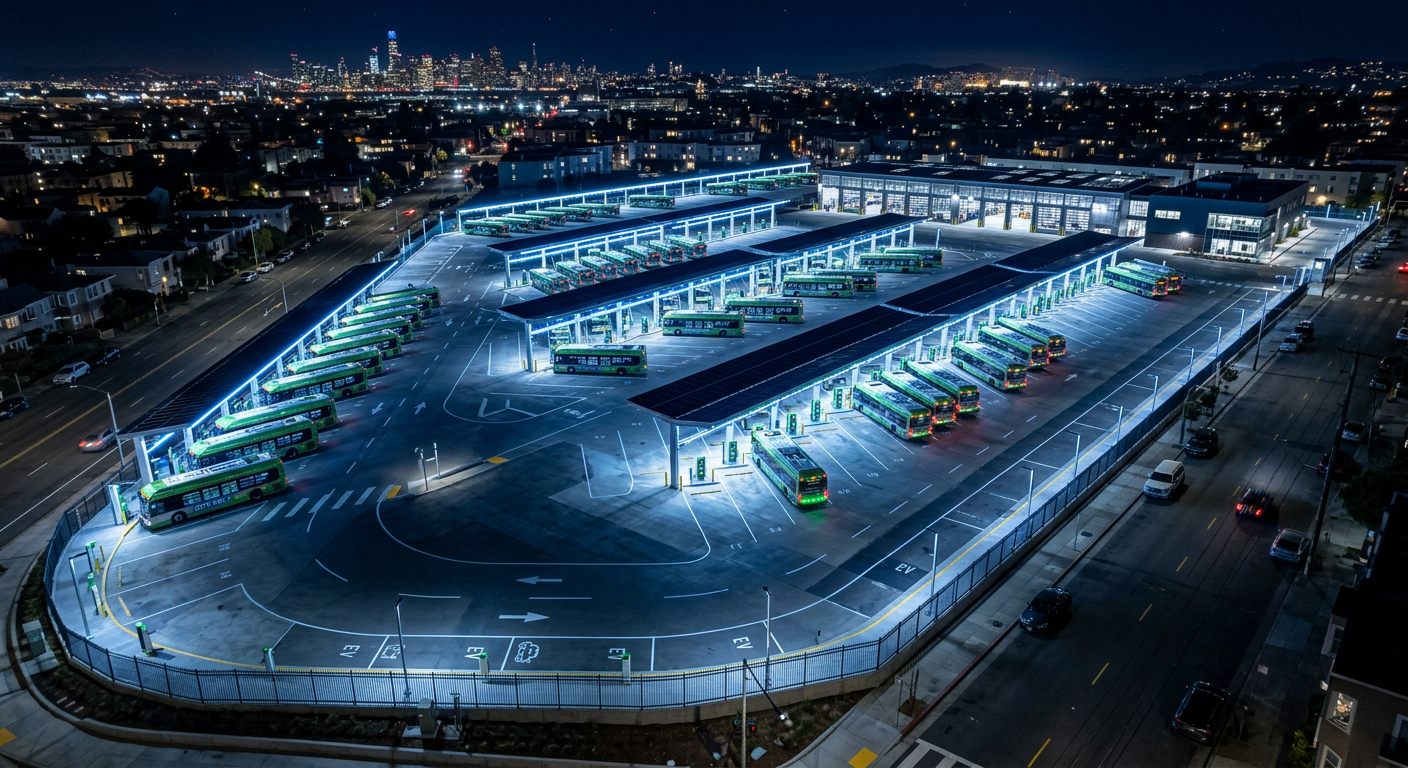
Aerial view of an electric bus depot at night with illuminated charging bays
Procurement and Specification Notes
If you’re writing an RFP for either system, a few specifications matter more than they look:
OCPP 2.0.1 compliance — both pantograph and plug-in chargers should support it for unified fleet management.
ISO 15118-20 readiness — needed for bidirectional charging if V2G enters your roadmap.
Power module redundancy — N+1 configurations keep buses moving when a module fails mid-shift.
Operating temperature range — specify -30°C to +50°C if your depot sees extremes. Many off-the-shelf chargers derate above 35°C ambient.
Cable length and management — for plug-in, 5m liquid-cooled cables with overhead retractors reduce trip hazards in busy depots.
Pantograph charging is a specialized tool — brilliant for opportunity charging on routes that never stop, expensive overkill for depots with normal overnight windows. Plug-in DC charging at 150–180 kW per dispenser, combined with smart load balancing, handles the vast majority of transit electrification cases at a fraction of the cost. Hybrid deployments are where the industry is heading, but only after you have real operational data to justify the pantograph stalls.
evaisun designs and manufactures depot-grade DC chargers and integrates with pantograph infrastructure partners for OEM and ODM fleet projects worldwide. If you’re scoping a transit electrification rollout and want a second opinion on topology, power sizing, or connector strategy, get in touch with our engineering team — we’ll work through your route data with you before anyone talks hardware.
Subscribe the newsletter to get updated to news and promotions
Cookies give you a personalized experience,Сookie files help us to enhance your experience using our website, simplify navigation, keep our website safe and assist in our marketing efforts. By clicking "Accept", you agree to the storing of cookies on your device for these purposes. Click "Adjust" to adjust your cookie preferences.For more information, review our Cookie Policy